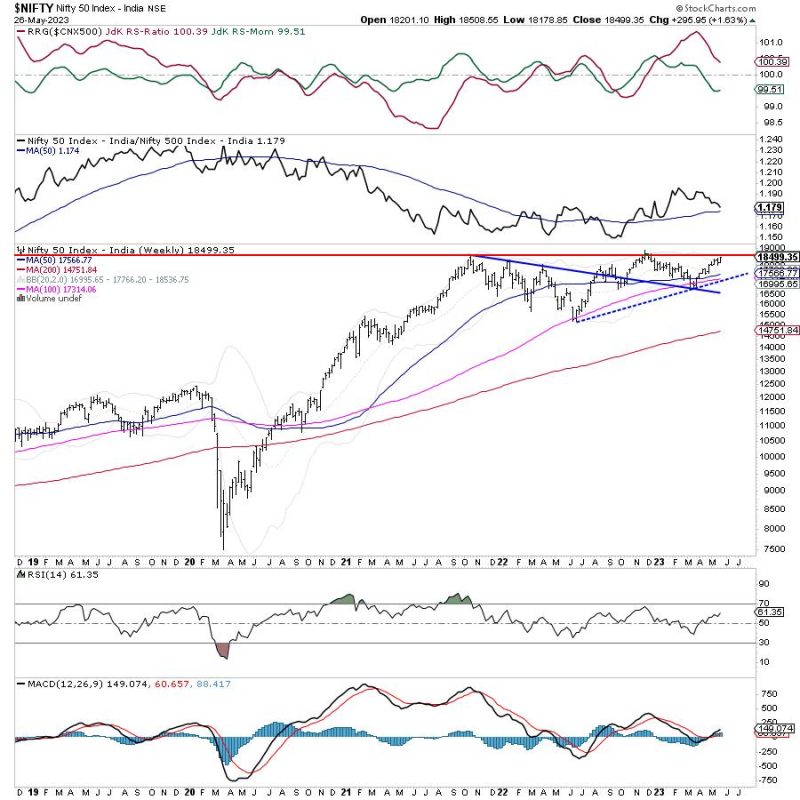
After taking a brief breather last week, the Indian equities extended their up move this time. After trading buoyant and with limited downsides all through the last five sessions, the headline index ended on a decently positive note. The Nifty oscillated in a 329.70 points range and while it ended towards its high point, the volatility gauge INDIAVIX once again declined towards its lower levels seen in the recent past. The uncertainty around the US Debt Ceiling remained as the US markets awaited some deal but stayed largely buoyant. Amid strong setup, the benchmark index closed near its crucial levels while posting a decent weekly gain of 295.95 points (+1.63%).
We enter a “decisive” week; going by the technical setup on the charts, markets may look at initiating a definite directional bias this week and whatever trend it catches on may stay on at least for the short term. There is also something important that one needs to understand about the US Debt Ceiling crisis. The debt ceiling is the maximum amount of money that the United States can borrow cumulatively by issuing bonds. The debt ceiling was created under the Second Liberty Bond Act of 1917 and is also known as the debt limit or statutory debt limit. If U.S. government national debt levels bump up against the ceiling, then the Treasury Department must resort to other extraordinary measures to pay government obligations and expenditures until the ceiling is raised again which has been raised or suspended numerous times over the years to avoid the worst-case scenario: a default by the U.S. government on its debt.
A decision on this is still awaited as the leaders negotiate to lift the debt but also curb spending in the process. The negotiators are seen narrowing in on a two-year spending deal that would raise the debt ceiling for the same amount of time, extending it past the 2024 elections. It is also important to note that the deadline for this is June 01, the deal is expected to come in at the eleventh hour the House of Representatives has left for a Memorial Day weekend; Monday is a holiday in the US.
Coming back to the markets, the Indices are at the cusp of a breakout and they have closed at very decisive levels. US Markets too have a similar setup; either the markets will stage a breakout over the coming week or any retracement will put a intermediate top in place sometime. Either way, there are heightened possibilities of a directional move getting started in the markets as the key indices are poised to move out of their consolidation zone. Markets may see a positive start to the week, the levels of 18590 and 18700 are likely to act as resistance; supports will come in at 18300 and 18150 levels.
The weekly RSI stands at 61.35; it has marked a 14-period high which is bullish. It stays neutral and does not show any divergence against the price. The weekly MACD is bullish and remains above its signal line.
The pattern analysis of the weekly chart shows that the NIFTY has closed below the major double-top resistance at 18604; this is the major high as the index was unable to surpass this and stage a breakout. In December 2022, NIFTY had retraced after a failed breakout attempted forming an intermediate high of 18887.
Over the coming days, two things need to be keenly watched. First will be the ability of NIFTY to move past 18600 levels; if this happens, it is set to test its lifetime high of 18887. Although the options data shows the Index trying to open up some room for itself on the upside, any inability or failure to move past 18600 will bring in corrective declines for NIFTY. To sum up, there are heightened possibilities of resumption of a directional move as the Index sits near decisive levels.
All in all, it is strongly recommended that despite the fact that the markets are at the cusp of a decisive move, the move has not yet happened and it has the potential to go in either direction. One must not go overboard in building up excessive directional positions until a clear trend emerges. While continuing to stay selective in approaching markets, a cautiously positive outlook is advised for the coming week.
Sector Analysis for the coming week
In our look at Relative Rotation Graphs®, we compared various sectors against CNX500 (NIFTY 500 Index), which represents over 95% of the free float market cap of all the stocks listed.
The analysis of Relative Rotation Graphs (RRG) shows that NIFTY Consumption, Midcap 100, Auto, Financial Services, and Realty are inside the leading quadrant. Nifty bank has also rolled inside the leading quadrant and we can expect these groups to relatively outperform the broader NIFTY 500 Index. The FMCG index is also inside the leading quadrant but given the rapid loss of relative momentum, it is about to roll inside the weakening quadrant.
The Nifty PSE and Infrastructure index are inside the weakening quadrant.
The IT index continues to languish inside the lagging quadrant along with the Metal and Media index. The other groups that are inside the lagging quadrant are the Services sector, Commodities, and the PSU Banks.
The NIFTY Pharma and the Energy indices are seen firmly placed inside the improving quadrant.
Important Note: RRG charts show the relative strength and momentum of a group of stocks. In the above Chart, they show relative performance against NIFTY500 Index (Broader Markets) and should not be used directly as buy or sell signals.
Milan Vaishnav, CMT, MSTA
Consulting Technical Analyst
www.EquityResearch.asia | www.ChartWizard.ae
